How do you single step your code?
-
I just started using the JSCAD web version. As my files get bigger I would like to use the debugger and set breakpoints.
When I open the inspector, I can see my file Under https://jscad.app/{unique id}
but I can not set a breakpoint.
I would rather not pepper my file with console.log statements.
How do you single step your code?
David Bolt
David.Bolt@SFCknox.org -
@David-Bolt The latest release has a change which retains the webworker thread. So, debugging should be easier now.
-
Actually, you can just put a
debuggerstatement in your design, chrome will pause at it, and then you can step through it. Neat. -
@david-bolt this is kind of tricky right now, but @z3dev just merged a pull request which will make it much easier, soon.
The problem is that chrome has a different set of break points for the Main Thread vs Web Workers. If you set a breakpoint on the main sources, it won't pause the debugger if that line of code is executed on a Web Worker. Which is a problem since JSCAD runs modeling in a worker.
You could set the breakpoint in the worker sources. But the problem is that on the currently published version of JSCAD, it loads a NEW worker for each render. Which resets the breakpoints.
@z3dev literally just merged a commit to master that retains the web worker, and I just tested locally, and it DOES enable you to step through:
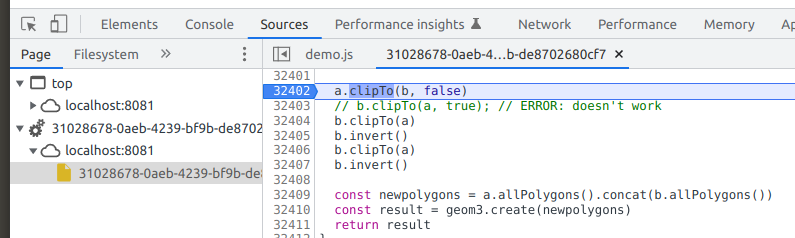
So your options are:
- run locally and add
console.logstatements - run locally and add
debuggerstatements - run locally latest version from master, and add breakpoints to Web Worker Sources
- wait for the next version to be cut (usually at least monthly), and then do (3) on the jscad website.
- run locally and add