How to generate JSCAD model in browser JS and display like demo.html?
-
Creating JSCAD model with functionality inside works pretty well with NodeJS:
https://forums.raspberrypi.com/viewtopic.php?p=2030878#p2030878https://www.openjscad.xyz/?uri=https://stamm-wilbrandt.de/en/forum/JSCAD.C60_vtype_b.js
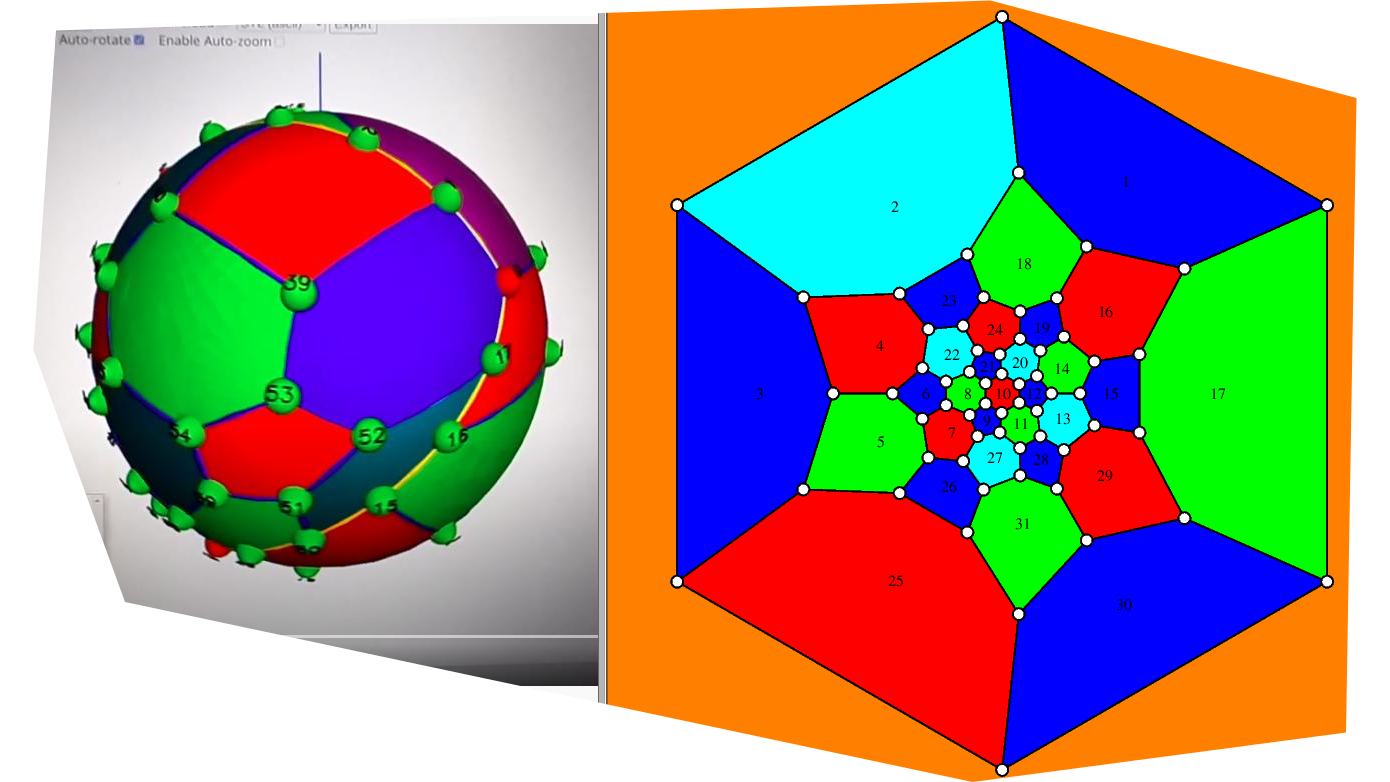
I can create planar embedding into plane in browser JS and display using SVG:
https://hermann-sw.github.io/planar_graph_playground/Now I want to create new JSCAD model in browser JS and then display it as with "demo.html" in local webserver or openjscad.xyz.
Is that possible?
If so, where can I find doc or an example? -
@hrgdavor I tried that with openjscad.xyz and it did not work. But it does work with locally hosted demo.html !
Thanks, until now I had browser console open right, editor in middle and only half of 3D view left. After drag and drop, I can close the editor and see new graphs whenever I run node.tetra.js to produce a different x.jscad. So much easier to work now ... -
@hrgdavor I follow up on graph algorithm work I stopped 28 years ago:
https://stamm-wilbrandt.de/en/TR/IAI-TR-93-10.ps.pdf
I built undirected graph library as basis already, it will grow over time. Currently output formats of the tools are SVG, PostScript, and OpenSCAD and JSCAD for sphere embeddings:
https://github.com/Hermann-SW/planar_graph_playgroundAll planar graphs can be 4-colored (face as well as vertex, faces/vertices sharing an edge have to get different colors), there is a linear time algorithm for 5coloring, and I have built an even simpler 6coloring algorithm: https://github.com/Hermann-SW/planar_graph_playground/blob/main/undirected_graph.js#L311-L332
Yesterday I made 6coloring work for JSCAD sphere embedding, 6coloring for embedding into the plane worked long ago:
https://forums.raspberrypi.com/viewtopic.php?p=2032214#p2032214
6coloring algorithm did use 5 colors only for sphere spherical face coloring (of C60 fullerene) left:
https://www.youtube.com/watch?v=Zl-KumZDBbQ

-
Also if you have commandline that produces a jscad script to be executed, you can use jscad to view it without placing it online
if you have a commandline like:
command_produce_sth_for_jscad.sh > test.jsthen you open https://openjscad.xyz/ and turn on
Auto reloadand drag and drop thetest.jseach time you want to update the output you can run
command_produce_sth_for_jscad.sh > test.js
and jscad will notice changed file and reload it. -
That looks cool. What is the the use case for those planar graphs ?
-
Thanks for the pointers, I will look into. Yesterday I found a solution myself, I just had incorrect mindset. Details of the (surprisingly small) diff needed in this posting:
https://forums.raspberrypi.com/viewtopic.php?p=2031648#p2031648This is new mode JSCAD_ running graph algorithms, system of linear equations solver and "main()" for viewing in browser:
https://openjscad.xyz/?uri=https://stamm-wilbrandt.de/en/forum/JSCAD_.1.jsShould show like this browser with Auto-zoom enabled:
JSCAD_ takes longer than JSCAD mode, because running graph algorithms ...
Also JSCAD_ output is 36KB, JSCAD only 19KB. -
@Hermann-SW There several examples of websites mentioned in this user group, so you might want to contact those authors.
It seems that you already stumbled across the simple demo as part of regl-renderer. You could build upon that, or adopt one the frameworks, such as React.
You can find some links on the User Guide. I'm trying to keep this up to date.